
Perceptual Style Theory Research
Perceptual Style Theory Reliability and Validity
Perceptual Style Theory™ (PST) was created by Gary Jordan, Ph.D., and Lynda-Ross Vega. It is the result of over 40 years of research and practical application. PST is a framework for explaining human behavior based on differences in perception. (You can learn more about the theory itself here.)
PST is supported by two assessments that measure Perceptual Style™ and Recognized Strengths.
The two things people are most curious about when using assessments are reliability (consistency over time and across items) and validity (does it measure what it says it measures).
We’ve done several studies over the years to establish both the reliability and validity of the Perceptual Style™ Assessment and the Recognized Strengths Profile™ Assessment, and we are very proud of the results.
The following information is not for the faint-hearted – we hope you like graphs, charts, and numbers!
The Assessments
Perceptual Style Assessment (PSA): The function of the PSA is to measure an individual’s unique Perceptual Style. However, perception cannot be directly measured, so it was necessary to use a behavioral artifact that reflected an individual’s underlying perception to determine Perceptual Style. Research revealed that self-selected descriptive adjectives provide the most reliable reflection of individual Perceptual Style. The PSA consists of 264 adjectives rated on a five-point Likert scale ranging from "never like you" to "always like you". The result of the PSA is one of the six possible Perceptual Styles described by PST.
Recognized Strengths Profile Assessment (RSP): PST states that each Perceptual Style supports an innate set of potential skills, abilities, and capacities and that individuals function most effectively and with the greatest satisfaction when performing skills and acting in capacities naturally supported by their Perceptual Style. The RSP compares an individual’s preferred Natural Action Capacities (NACs) against those that are innately supported by their Perceptual Style and reveals areas of consciously realized talent and unrealized potential as well as the expression of acquired roles and skills not aligned with their Perceptual Style. The RSP consists of 144 sets of three roles in which an individual rank orders one role as the one they would be “most comfortable” performing and one role as the one they would be “least comfortable” performing.
Assessment Reliability - Perceptual Style
The reliability of an instrument refers to the extent to which the test results are repeatable and consistent. Over the years, three separate investigations have examined the internal consistency of the Perceptual Style scales measured in the PSA.
Cronbach’s alpha was used as the measure of reliability. When comparing several sets of data, Cronbach’s alpha measures how well the sets fit a single one-dimensional construct. Cronbach’s alpha is a coefficient of correlation similar to an r2 coefficient of correlation, except that, where r2 measures the correlation between two sets of data, Cronbach’s alpha measures the inter-correlations between multiple sets of data. The interpretation is similar: an alpha of one represents perfect correlation, while an alpha of zero represents maximum randomness. The alpha reliabilities for the standardized scales of the six Perceptual Styles as measured in the most recent study conducted in 2003, are presented in the following table:
-
Alpha Reliability Coefficients
-
2003 Sample
- Scale
- Vision
- Goals
- Methods
- Adjustments
- Flow
- Activity
- Alpha
- .85
- .97
- .92
- .87
- .92
- .92
These findings show that the internal consistency of the Perceptual Styles scales within the PSA exceeds the generally accepted levels of .70 commonly used to establish reliability.
Assessment Reliability – Natural Action Capacities (Recognized Strengths)
The PST NAC scales and the RSP were not established until 1991 and, therefore, were not included in the two studies conducted prior to 2003. These scales were included in the 2003 study.
The Cronbach’s alpha correlations in the 2003 study resulted in a median reliability of .81, and five roles had alpha coefficients less than .70. Subsequent analysis revealed that some adjectives in the inventory used to determine capacity preference were more commonly understood in wider definitions than was useful for the inventory assessment. As a result, the adjectives list was reformed to replace those adjectives with words more narrowly perceived, and additional comparative items were added to make the inventory more robust against the natural variances in understanding.
A preliminary investigation was conducted in 2004 using 50 subjects to determine if reliability had improved as a result of the modifications to the inventory. The results of this study are presented in the table below, which shows that all of the 18 scales have acceptable alpha coefficients. Given that small sample sizes generally understate reliability, we believe this investigation indicates the modified inventory is sufficiently reliable.
-
Alpha Reliability Coefficients
-
2004 Sample
- Scale
- Initiator
- Orchestrator
- Strategist
- Director
- Delegator
- Advisor
- Negotiator
- Implementer
- Expert
- Mediator
- Proceduralist
- Researcher
- Liaison
- Maintainer
- Enroller
- Representative
- Arranger
- Connector
- Alpha
- .88
- .76
- .80
- .84
- .86
- .81
- .76
- .87
- .88
- .79
- .86
- .91
- .90
- .71
- .84
- .85
- .70
- .83
Assessment Validity
The validity of an instrument refers to the extent to which it measures what it is intended to measure. Psychologists have established three types of test validity – Content, Construct, and Criterion (consisting of concurrent and predictive).
The properties of the numbers produced by type indicators (as opposed to trait indicators) require a focus on construct and criterion validity.
Construct validity refers to the extent to which an instrument’s measurements correlate to a theoretical construct.
The first construct of PST to be validated is the relationship of the six Perceptual Styles to each other. While the six Perceptual Styles describe six distinct psychological realities, the PST model asserts a circular relationship between them, as shown in the table below. This implies a specific pattern of correlation among the six Perceptual Style scales. This pattern should exhibit a circumplex structure, which is to say that the score of a particular Perceptual Style should exhibit a strong positive correlation with the scores of adjacent Perceptual Styles and minimal or negative correlation with the scores of opposite Perceptual Styles.
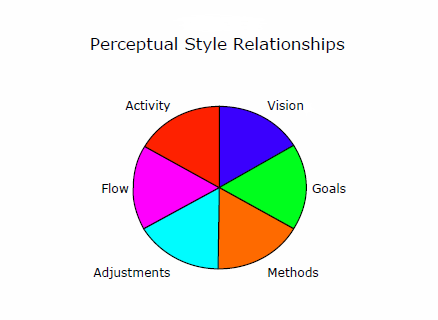
Note that the six Perceptual Styles do not lend themselves to overlaying on two mathematical axes (x and y). Therefore, a traditional circumplex plot is not possible. However, the existence of the circular ordering can be demonstrated by plotting every pair-wise correlation in a hexagonal structure in which the center point equals a correlation of -1.00, the outer edge equals a correlation of +1.00, and the midpoint between the two equals a correlation of 0.00.
If a circumplex relationship exists, correlations will decrease as the distance between the two pairs of Perceptual Styles increases.
The table below shows the pair-wise plot for the six Perceptual Styles from the 2003 study of 227 subjects and reveals the predicted structure.
Prior studies did not include construct validity measures for the NACs. This was due, in part, to the complex nature of the theoretical relationship between them. As the Perceptual Styles form a circle, the NACs form a torus.
Criterion validity refers to the extent to which an instrument’s measurements correlate to a concurrent or predicted measure. A review of the 2004 research project by independent test construction experts determined that, as PST is an original styles theory, there are no comparable measures with which to establish concurrent validity. However, PST does lend itself to a measure of predictive validity. Discussions with test construction experts have resulted in the definition of an acceptable methodology, which will be employed in a future research project. The process will use a selected group of approximately 50 individuals who will be interviewed on video using standardized interview questions. These questions will be designed to elicit data that can be assessed by PST subject matter experts for Perceptual Style and the NACs. The subject matter expert assessments will be performed independently and the results correlated with inventory results.
Research Updates
For information about the content of this page or regarding current or future research activities, please contact Gary M. Jordan, Ph.D. using one of the following methods:
-
Our mailing address is:
-
Your Talent Advantage
-
1540 Keller Parkway, Suite 108-324, Keller, Texas 76248
-
Our Email is: